
Key Takeaways
Key Takeaways
- Traditional technical analysis still matters, but price-only analysis is no longer enough.
- Modern Nifty and Bank Nifty movement is affected by options positioning, expiry behavior, volatility, breadth, and participant flows.
- Breakouts fail more often when they occur into crowded zones, weak breadth, or option-heavy resistance.
- A good trader should read price, but also ask what is happening underneath price.
- This is the mindset behind the Nifty3DView Risk Desk: study what passed, what failed, and why.
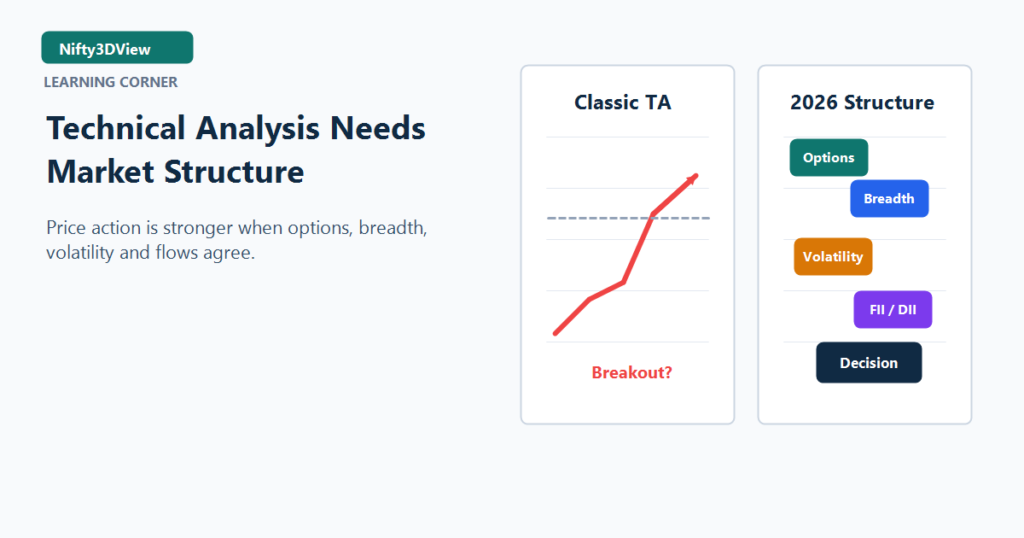
The Market Has Changed
Older technical analysis was built around a simple assumption: price and volume reveal enough about market behavior. That assumption still has value, but it is incomplete in a market where index options, expiry cycles, high retail participation, automated execution, and fast information flow shape intraday and short-term movement.
In a slower market, a breakout above resistance often meant fresh demand was overwhelming supply. In the current market, the same breakout may also be an options adjustment, a stop run, a volatility squeeze, or a short-lived liquidity event.
This does not mean technical analysis is useless. It means technical analysis needs context.
2010 Market Versus 2026 Market
| Layer | Older Market Behavior | Modern Market Behavior |
|---|---|---|
| Price levels | Cleaner reaction around support/resistance | More false breaks and quick reversals |
| Options impact | Less visible for many retail traders | Central to index behavior and expiry movement |
| Retail behavior | Slower participation | Faster participation through apps and weekly speculation |
| Information flow | News moved slower | News, rumors, and data spread instantly |
| Execution | More manual | More algorithmic and rule-based |
| Volatility | Often easier to separate into trend/range | Clusters around events, expiry, and positioning |
The trader who only draws a line on the chart may miss the real fight happening under that line.
Why Price-Only Analysis Is Incomplete
Price shows the final result of all buying and selling. It does not directly show why the move happened.
A green candle can come from:
- genuine delivery-led buying
- short covering
- option-writer adjustment
- low-liquidity stop run
- event reaction
- temporary index-heavy buying
These are very different situations. If a trader treats all green candles as the same, the analysis becomes fragile.
Why Breakouts Fail More Often
Breakouts fail when price moves beyond a known level but does not attract follow-through demand.
Common reasons:
- the breakout occurs into heavy call-writing zones
- market breadth does not confirm the move
- the move is driven by short covering, not fresh buying
- the broader regime is defensive
- volatility is compressed before an event
- too many traders are watching the same level
A breakout is not confirmed just because price crosses a line. It needs participation, context, and acceptance.
What Smart Traders Watch Instead
A more complete market view combines layers.
| Layer | What It Adds |
|---|---|
| Price action | Direction, structure, and important levels |
| Volume | Participation behind the move |
| Open interest | Positioning and pressure points |
| Option chain | Strike behavior, support/resistance zones, and expiry risk |
| Volatility | Whether the market is expanding or compressing |
| Breadth | Whether the move is broad or index-heavy |
| FII/DII context | Institutional flow background |
| Risk filters | Whether a setup deserves action, review, or rejection |
A Modern Daily Checklist
Before trusting a setup, ask:
- Is the market regime supportive or defensive?
- Is the index near an option-heavy decision zone?
- Is breadth confirming the move?
- Is volatility expanding or compressing?
- Is the setup near an obvious liquidity trap?
- Are traders crowded on one side?
- What would invalidate the view?
- Is this an action setup, a review setup, or a no-trade setup?
How This Connects To Risk Desk Thinking
The Nifty3DView Risk Desk is built around a simple idea: the strongest intelligence is not only what looks attractive. It is also what should be rejected.
That is why market structure matters. A chart pattern may look clean, but if the market regime is weak, breadth is narrow, volatility is unstable, and options positioning is hostile, the correct decision may be to wait.
See the applied framework in the Risk Desk sample, check the latest market view, or join Risk Desk beta updates.
Continue The Modern Market Structure Series
- The New Market Reality: Why Technical Analysis Needs Market Structure in 2026
- Expiry Day Physics: How Option Writers Shape Nifty Movement
- Why Breakouts Fail: Liquidity, Stops and Crowded Trades
- The Hidden Battle Between Option Buyers and Option Writers
- Who Really Moves the Market: Retail, FIIs, DIIs, Algos or Option Writers?
- The Nifty Market Map: A Complete Framework for Reading Indian Markets
Risk Warning
Market-structure analysis improves context, but it does not remove uncertainty. No framework can guarantee a market outcome.