Key Takeaways
Key Takeaways
- No single indicator explains the market.
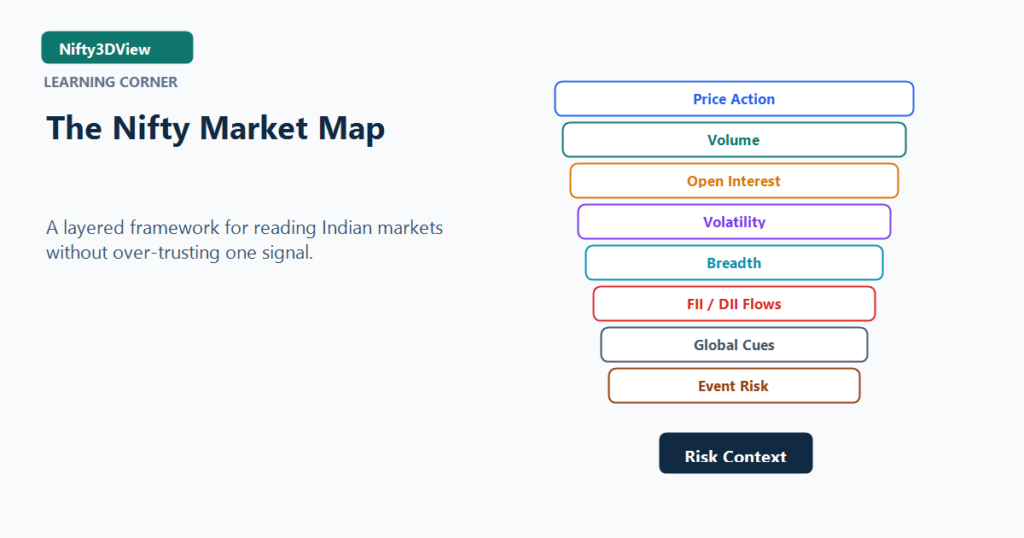
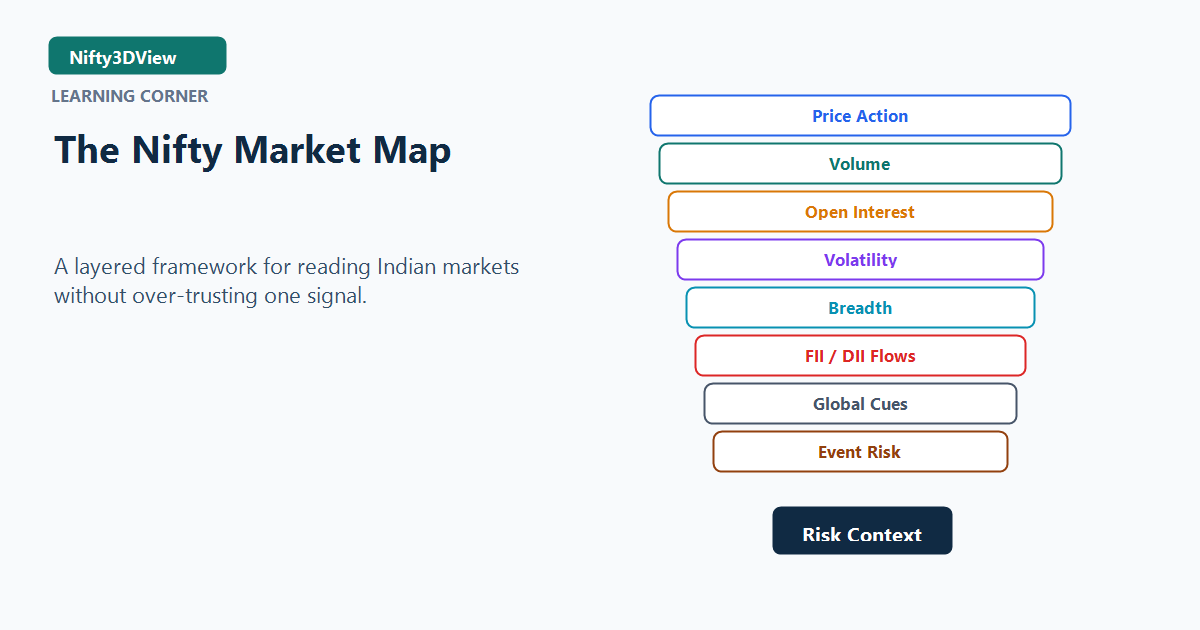
- Nifty should be read through multiple layers: price, volume, OI, volatility, breadth, flows, global cues, and risk.
- Each layer answers a different question.
- The final decision should classify the market as action, review, or no-trade.
- This framework becomes the base map for future Nifty3DView Learning Corner posts.
Why Traders Need A Market Map
Most traders collect indicators. Fewer traders organize information.
A market map solves that problem. It gives every data point a role. Price shows structure. Volume shows participation. Open interest shows positioning. Volatility shows pressure. Breadth shows internal health. Flows show institutional context. Risk filters decide whether the setup deserves action.
The map does not predict the future. It prevents random thinking.
Layer 1: Price Action
Price action answers: What is the market doing?
Look for:
- trend direction
- support and resistance
- higher highs or lower lows
- failed breakouts
- range behavior
- acceptance above or below key zones
Price is the first layer, not the only layer.
Layer 2: Volume
Volume answers: Is participation supporting the move?
A breakout with weak participation deserves caution. A decline with expanding participation may signal stronger pressure. Volume helps separate meaningful movement from empty movement.
Layer 3: Open Interest
Open interest answers: Where is positioning building?
For index traders, OI helps identify:
- important option strikes
- resistance and support zones
- writing and unwinding behavior
- potential pressure points near expiry
OI does not give certainty. It gives positioning context.
Layer 4: Volatility
Volatility answers: Is the market expanding or compressing?
Low volatility can create complacency. High volatility can create opportunity and danger. Volatility changes how far price can move, how options behave, and how risk should be sized.
Layer 5: Market Breadth
Breadth answers: Is the move broad or narrow?
If Nifty rises because only a few heavyweights are strong, the move may be weaker than it looks. If many sectors and stocks participate, the market has healthier structure.
Layer 6: FII/DII Context
FII and DII flows answer: What is the institutional background?
Flows are useful, but they should not be treated mechanically. The market's reaction to flows matters as much as the numbers.
Layer 7: Global Markets
Global cues answer: Is the broader environment supportive or hostile?
Indian markets can react to global risk appetite, currency movement, commodities, bond yields, and overnight equity-market behavior. Global context is not always dominant, but it should not be ignored.
Layer 8: Events And Risk
Events answer: What can change the market quickly?
Watch for:
- policy events
- earnings-heavy periods
- inflation or rate data
- geopolitical headlines
- expiry sessions
- major corporate announcements
Event risk can override clean chart patterns.
Combining The Layers
| Decision | What It Means |
|---|---|
| Action-quality | Price, participation, regime, and risk align |
| Review-only | Some evidence exists, but context is incomplete |
| Reject | Risk, regime, or confirmation is too weak |
| No-trade | Market is unclear, noisy, or poorly priced |
The goal is not to force a trade. The goal is to classify the environment.
Practical Daily Framework
Use this order:
1. Define market regime. 2. Mark key price zones. 3. Check breadth. 4. Check option-chain pressure. 5. Check volatility. 6. Review FII/DII and global context. 7. Identify event risk. 8. Decide whether the setup is action, review, reject, or no-trade.
How This Links To Risk Desk
The Risk Desk is the market map applied as a repeatable workflow.
It is not just a list of possible trades. It is a structured view of market regime, index zones, review-only ideas, blockers, and rejection reasons.
Start with the latest market view, study the Risk Desk sample, and join Risk Desk beta updates if you want to follow the buildout.
Continue The Modern Market Structure Series
- The New Market Reality: Why Technical Analysis Needs Market Structure in 2026
- Expiry Day Physics: How Option Writers Shape Nifty Movement
- Why Breakouts Fail: Liquidity, Stops and Crowded Trades
- The Hidden Battle Between Option Buyers and Option Writers
- Who Really Moves the Market: Retail, FIIs, DIIs, Algos or Option Writers?
- The Nifty Market Map: A Complete Framework for Reading Indian Markets
Risk Warning
A market map improves structure, but it does not guarantee outcomes. Use it as an educational framework, not a prediction machine.