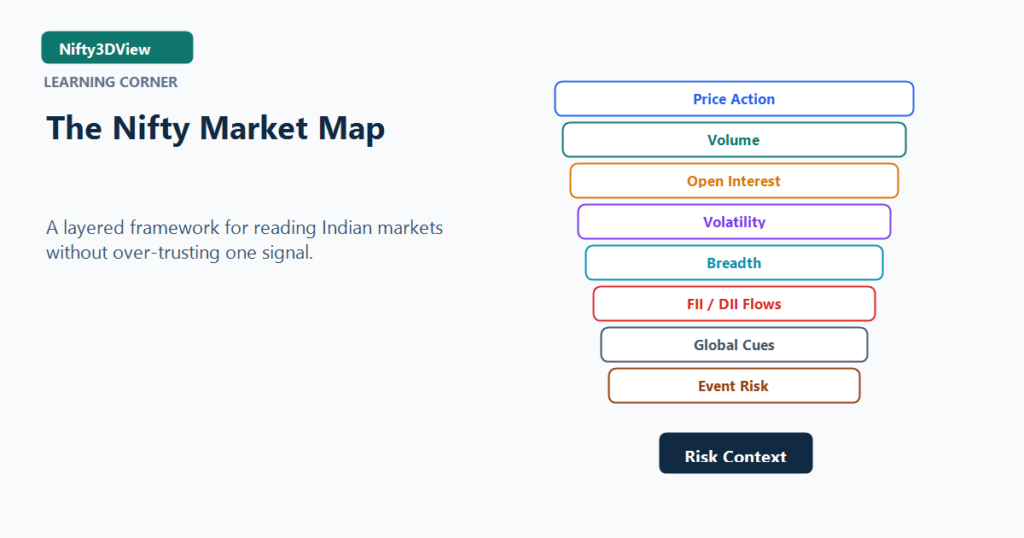
The Nifty Market Map: A Complete Framework for Reading Indian Markets
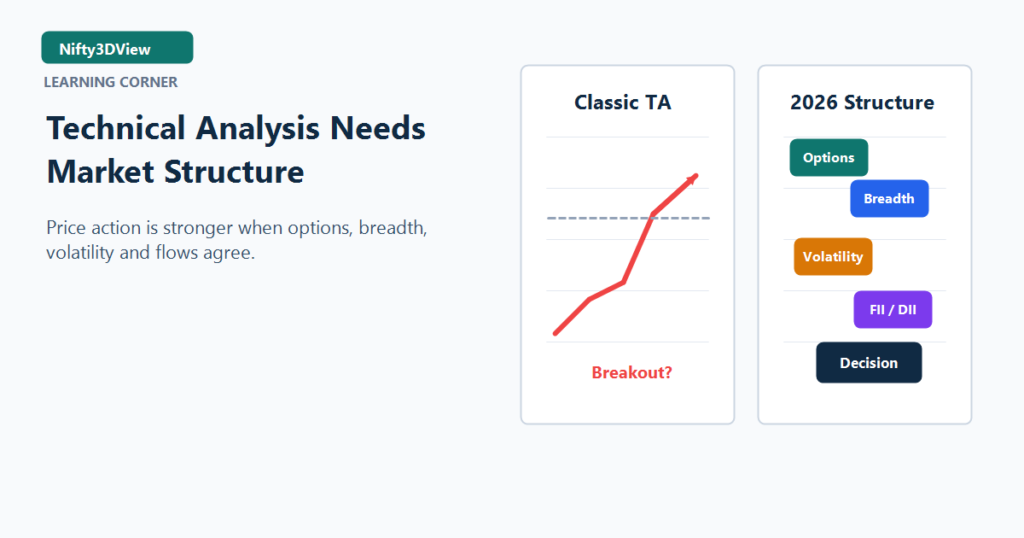
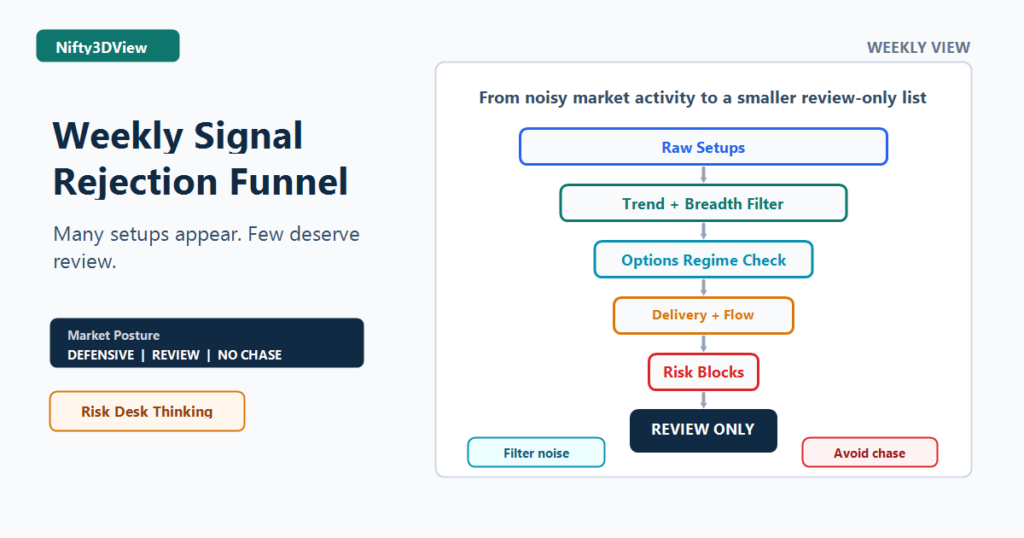
A flagship Learning Corner framework for reading Nifty and Indian markets through price, volume, open interest, volatility, breadth, flows, global cues, and risk.
The Nifty Market Map: A Complete Framework for Reading Indian Markets Read More »